Month-end financials get assembled by hand — pulling G/L exports, layering in loan data, and reformatting everything into a spreadsheet that took days to build and breaks when someone changes a formula.
Month-end financials get assembled by hand — pulling G/L exports, layering in loan data, and reformatting everything into a spreadsheet that took days to build and breaks when someone changes a formula.
When a line item looks wrong, tracing it back to the source means exporting data and cross-referencing manually. There's no way to drill down from a report to the transactions that produced it.
Showing current month alongside prior month, prior year, or budget requires building separate reports and stitching them together — a process that has to be repeated every single month.

Period-Based Reporting
See any time period, any comparison, in a single report.
Build financial performance reports that show multiple time periods as columns — current month, prior month, quarter-to-date, year-to-date, and same period last year — all in one view, always pulling live data.
Configurable time period columns
Choose from MTD, QTD, YTD, fiscal year-to-date, life-to-date, or a custom date range. Each column is independently configurable, so you can show exactly the comparison your leadership team needs without rebuilding the report each month.
Period offsets for automatic comparisons
Set a column to "prior month" or "same month last year" using a simple offset, and the report updates automatically every time you run it. No manual date adjustments, no separate prior-period reports.
Budget vs. actual columns
Add a budget column to any period report to see actual results alongside plan — with variance calculated automatically. If you maintain G/L budgets in Loan Vision, they flow directly into your financial reports.
Mortgage-specific row types
Include rows for funded loan count, funded dollar volume, sold volume, and gain-on-sale expressed in basis points — alongside your standard revenue and expense rows — in the same report.
Your monthly income statement is ready to present the moment the period closes, with every comparison your leadership needs already built in. Count ties to a specific loan, and immediately identify any amount that doesn't.
Dimension-Based Reporting
Compare performance across every part of your organization — side by side.
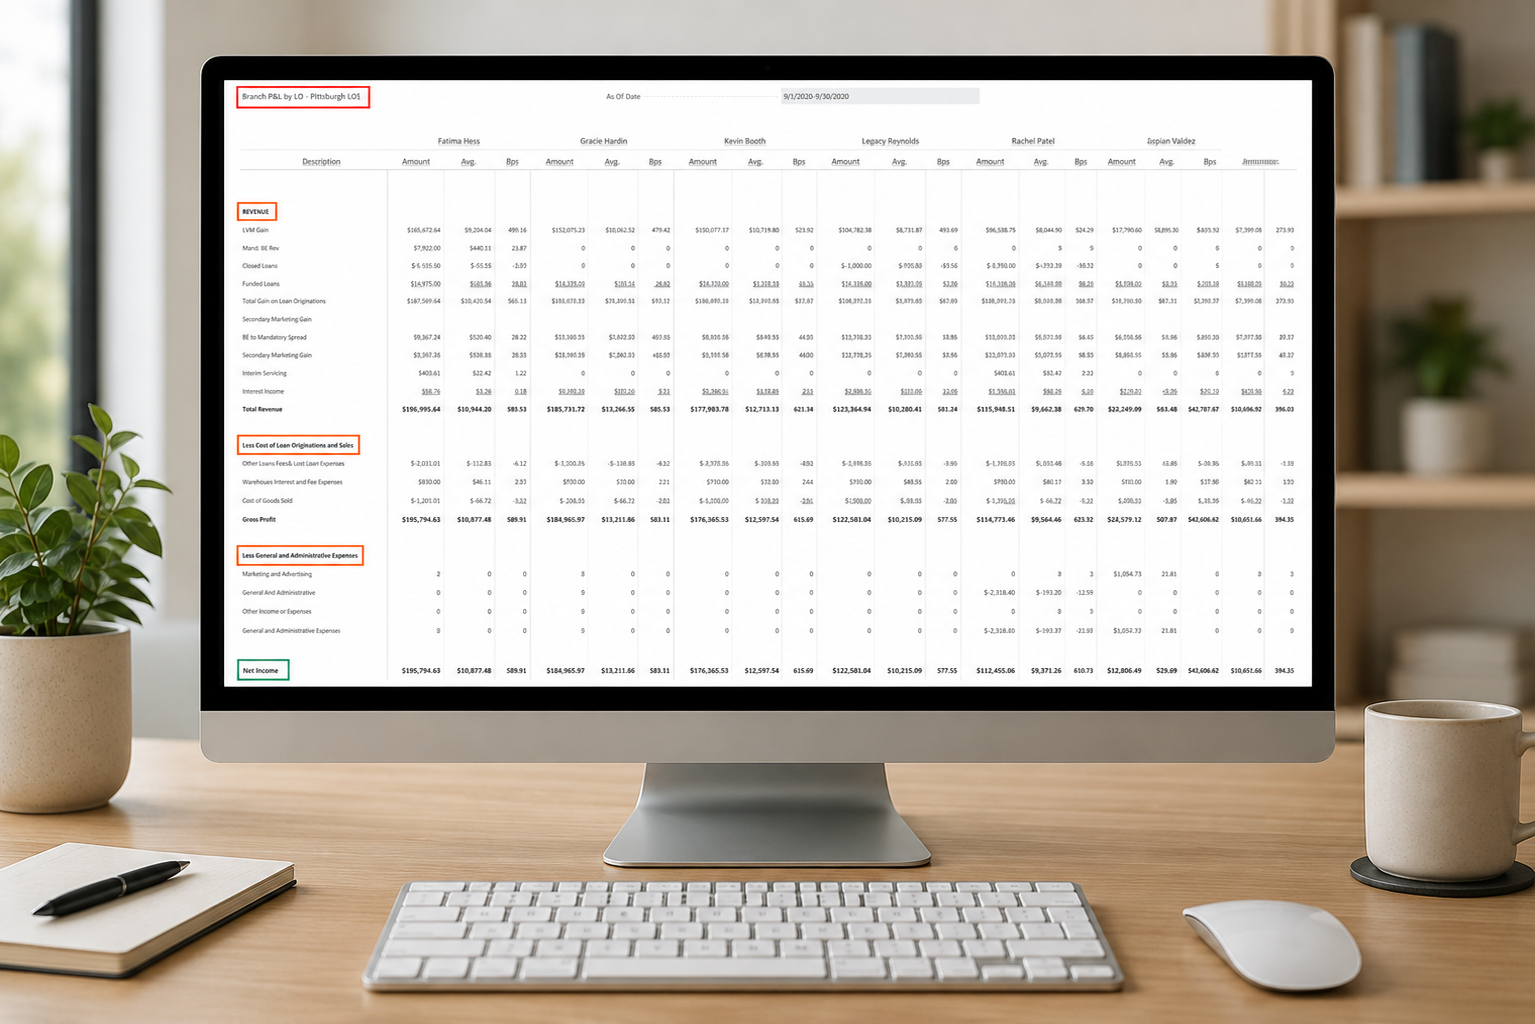
Run the same financial report with branches, channels, loan officers, or product types as columns instead of time periods. See who's performing, who isn't, and where margin is actually being made.
Branch and channel comparisons
Display every branch or production channel as a column in a single report, so leadership can compare revenue, expenses, and profitability across the organization without combining multiple reports.
Loan officer and product type views
Break performance down to the loan officer level or by product type — funded volume, revenue contribution, and cost-per-loan all available as report rows against any dimension as columns.
Auto-generated column layouts
Rather than building each column manually, Loan Vision generates one column per dimension value automatically. Add a new branch and it appears in the report the next time you run it.
Dimension filters per row
Restrict individual rows to a specific dimension value — useful for showing corporate overhead separately from production revenue, or isolating a specific channel's contribution to total volume.
Your quarterly business review is a single report run, not a manual assembly of branch-by-branch spreadsheets.
Branch & Leadership Dashboards
Give every leader the visibility they need without giving everyone access to everything.
Loan Vision's web-based dashboard puts real-time performance data in front of branch managers and regional leaders — filtered automatically to their scope of responsibility, accessible from any browser or device.
Role-based performance dashboards
Each branch manager sees their own branches. Each regional leader sees their region. Executives see the full picture. Visibility is controlled by user configuration, not by who calls accounting first.
Configurable performance metrics
Display the metrics that matter most to each role — funded count, funded volume, sold volume, pull-through rate, or G/L-based financial figures — with up to five summary metrics and per-branch tile breakdowns on the main dashboard.
KPI charts without a BI tool
Visual charts for funded loans by loan type, by loan officer, and by branch; sold loans by investor; and average days to fund and sell — all built in, no third-party analytics platform required.
Access to financial reports and loan-level data
Branch users can pull the same financial performance reports and loan-level detail reports that accounting runs — filtered to their scope — directly from their dashboard. Administrators control whether they can export the data.
Branch managers stop calling accounting for performance data. Regional leaders spot problems earlier. And your finance team spends less time fielding reporting requests.
Drill-Down & Investigation
Get from a variance to an answer in minutes, not hours.
Every number in every Loan Vision report is connected to the G/L entries that produced it. When something doesn't look right, you don't have to export data and cross-reference — you click through.
One-click drill-down from any report line
Click any amount in a period or dimension report and see the individual G/L entries behind it — posting date, document number, description, amount, and the loan or dimension it's tagged to.
GL-to-loan reconciliation
For any G/L account, see the balance broken out by individual loan number — so you can confirm that every dollar in the account ties to a specific loan, and immediately identify any amount that doesn't.
Loan-level profitability
See revenue versus expense broken down per loan, grouped by revenue category — so you can understand the true cost to originate and the net contribution of any loan in your portfolio.
Loan fees reconciliation
Compare fee expenses against fee revenue collected on a per-loan basis, confirming that fees are being collected as expected and identifying any gaps before they become a pattern.
Month-end variance investigation shrinks from a half-day process to a 15-minute one — and your controller has the documentation to back every adjustment.
Report Packages & Exports
Produce your entire reporting package in one step.
Whether it's a monthly board deck, an investor report, or a branch performance package, Loan Vision lets you bundle multiple reports into a single executable batch that produces a multi-tab Excel workbook — every time, in the same format.
Multi-report batch execution
Group multiple financial reports, dimension views, and loan-level reports into a single batch. Run the batch once, enter a date range, and receive a complete Excel workbook with one tab per report.
Automatic per-dimension tabs
Configure a batch to automatically generate a separate worksheet for each branch, channel, or other dimension value — so your monthly branch package expands automatically as your organization grows.
Excel and PDF export
Any individual report can be exported to Excel for further analysis or to PDF for distribution. Formatting, row styles, and column layouts carry through to the exported file.
Ad-hoc analysis via Excel integration
For finance teams that need to go beyond the built-in reports, Loan Vision's data is accessible through the Business Central Excel add-in — letting analysts build custom views that refresh against live data without re-exporting.
Your monthly reporting package goes from a half-day manual process to a single button click — in the same format, every month, with no reformatting required.